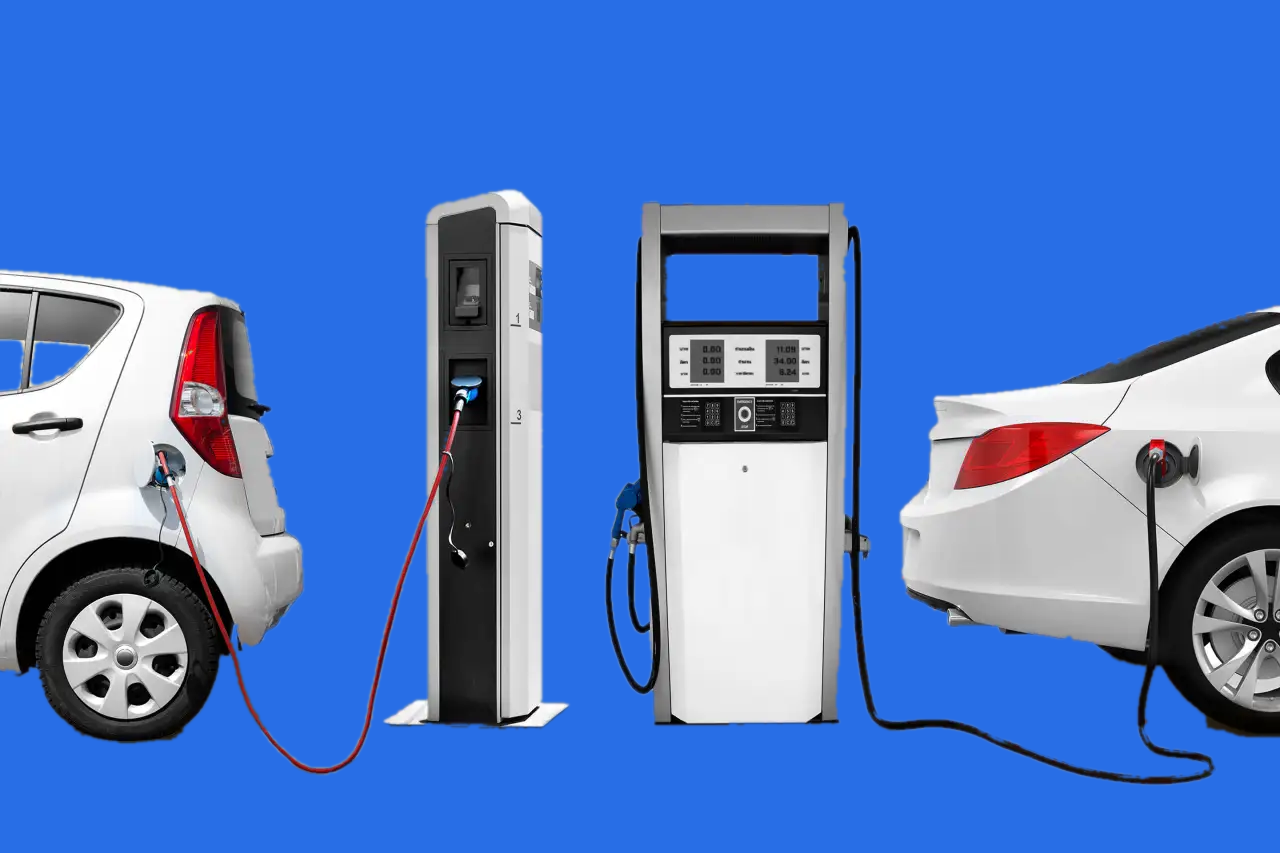
Electric cars tend to cost more upfront. Gas cars usually cost less to buy, but more to run. The question most drivers care about is simple: over the years, which one costs less to own?
That’s what this calculator shows.
What the calculator includes (and excludes)
We compare the total cost of ownership (TCO) over the years you set. The tool adds up the big line items that differ between EVs and gas cars and leaves out the ones that don’t.
Included
- Purchase cost after tax/VAT and any incentive you enter.
- Energy/fuel based on:
- EV efficiency (kWh per 100 km),
- charging losses (energy lost while charging),
- your split between home and fast charging, and
- your electricity prices.
- Gas fuel use (L/100 km) and price per litre.
- Maintenance per year (you enter it for each car).
- Resale value at the end (you can enter a % of price or a number).
Excluded (on purpose)
- Insurance and registration/road fees — these often apply to both and can blur the comparison.
- Finance/interest, home-charger install, parking, tolls, fines, tyres, and repairs beyond routine maintenance.
Default settings
The calculator loads with GBP, kilometres, and typical Europe placeholder prices. These are just starting points. Change any number to match your situation.
EV vs Gas — Lifetime Total Cost of Ownership
This version removes insurance and registration. Defaults use GBP, kilometres, and typical Europe prices—edit anything.
Electric vehicle (EV)
Gas / petrol car
How to use it (60-second guide)
- Set “Ownership years” and “Annual distance (km)” at the top.
- In the EV box, fill in purchase price, tax/VAT, any incentive, efficiency (kWh/100 km), your electricity prices, and maintenance per year.
- If you use fast chargers often, increase “% of km on fast charging.”
- In the Gas box, enter the car price, tax, fuel economy (L/100 km), fuel price, and maintenance per year.
- Choose how to enter resale value: as a % of price or a manual amount.
- Read the results:
- EV total TCO and Gas total TCO show the lifetime totals.
- Cost per km lets you compare apples to apples.
- Savings (EV vs Gas) tells you how much the EV saves (or costs) over the period.
- Break-even shows roughly how many kilometres you need to drive before the EV pulls ahead.
Tips for realistic numbers
- Use your actual tariff for home electricity and your typical public charging rate.
- If you mostly charge at home, keep fast-charging share low; if you road-trip a lot, raise it.
- Enter your real fuel economy (L/100 km) – ideally from your current driving – otherwise, advertised figures work.
- For resale, start with a percentage (e.g., 45% for EV, 35% for gas) and adjust to match your market.
- Run a best-case and worst-case scenario to see the range.
How to read the results
- If Savings is a positive number, the EV is cheaper to own over your chosen period.
- Break-even is useful if the EV costs more upfront. It shows the distance where lower energy and maintenance costs catch up.
- Cost per km is a handy, one-line metric to compare different models or trims.
Limitations to keep in mind
- Prices change. Electricity and fuel can move a lot year to year.
- Your driving pattern matters. Cold weather, speed, and terrain affect both EV and gas consumption.
- We exclude some costs by design (insurance, registration) to keep the comparison clean.
- We also don’t model battery replacement or home-charger install in this version. If you want those, add them to the EV side manually (as a one-off in purchase cost or maintenance).
