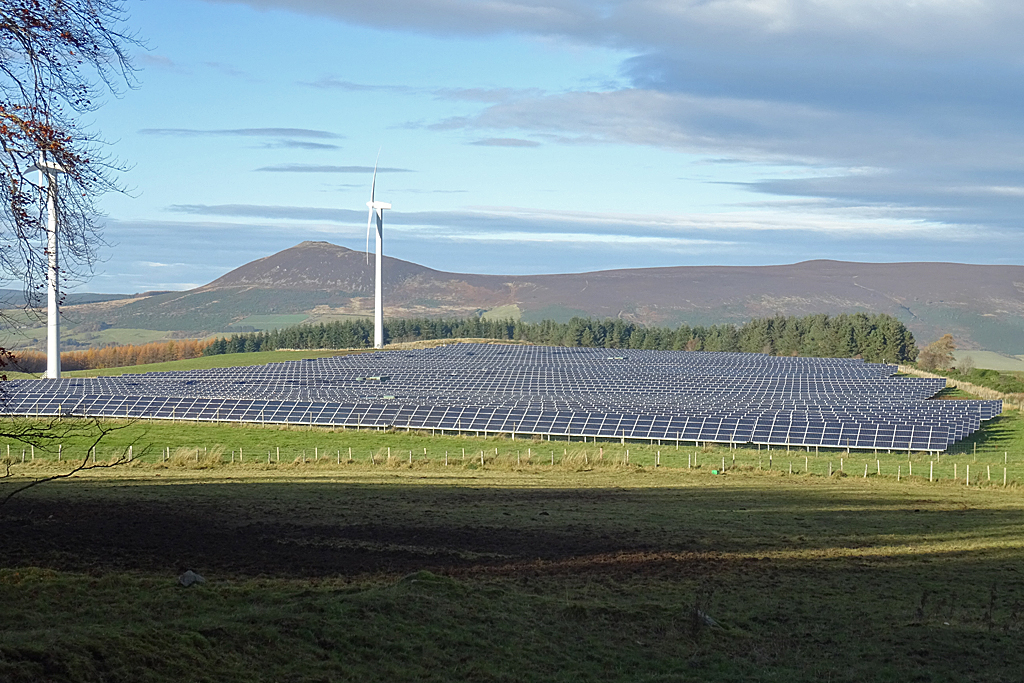
Britain’s energy makeover picked up a headline this month – a £10 billion clean-energy investment pact with Japan’s Sumitomo, promising new offshore-wind cables and battery storage that will knit more zero-carbon power into the U.K. grid. That deal neatly frames the deeper story told by the charts above: how far the United Kingdom has already shifted its energy diet – and how hard the last fossil calories will be to shed.
The U.K. two-step: coal collapse, gas plateau
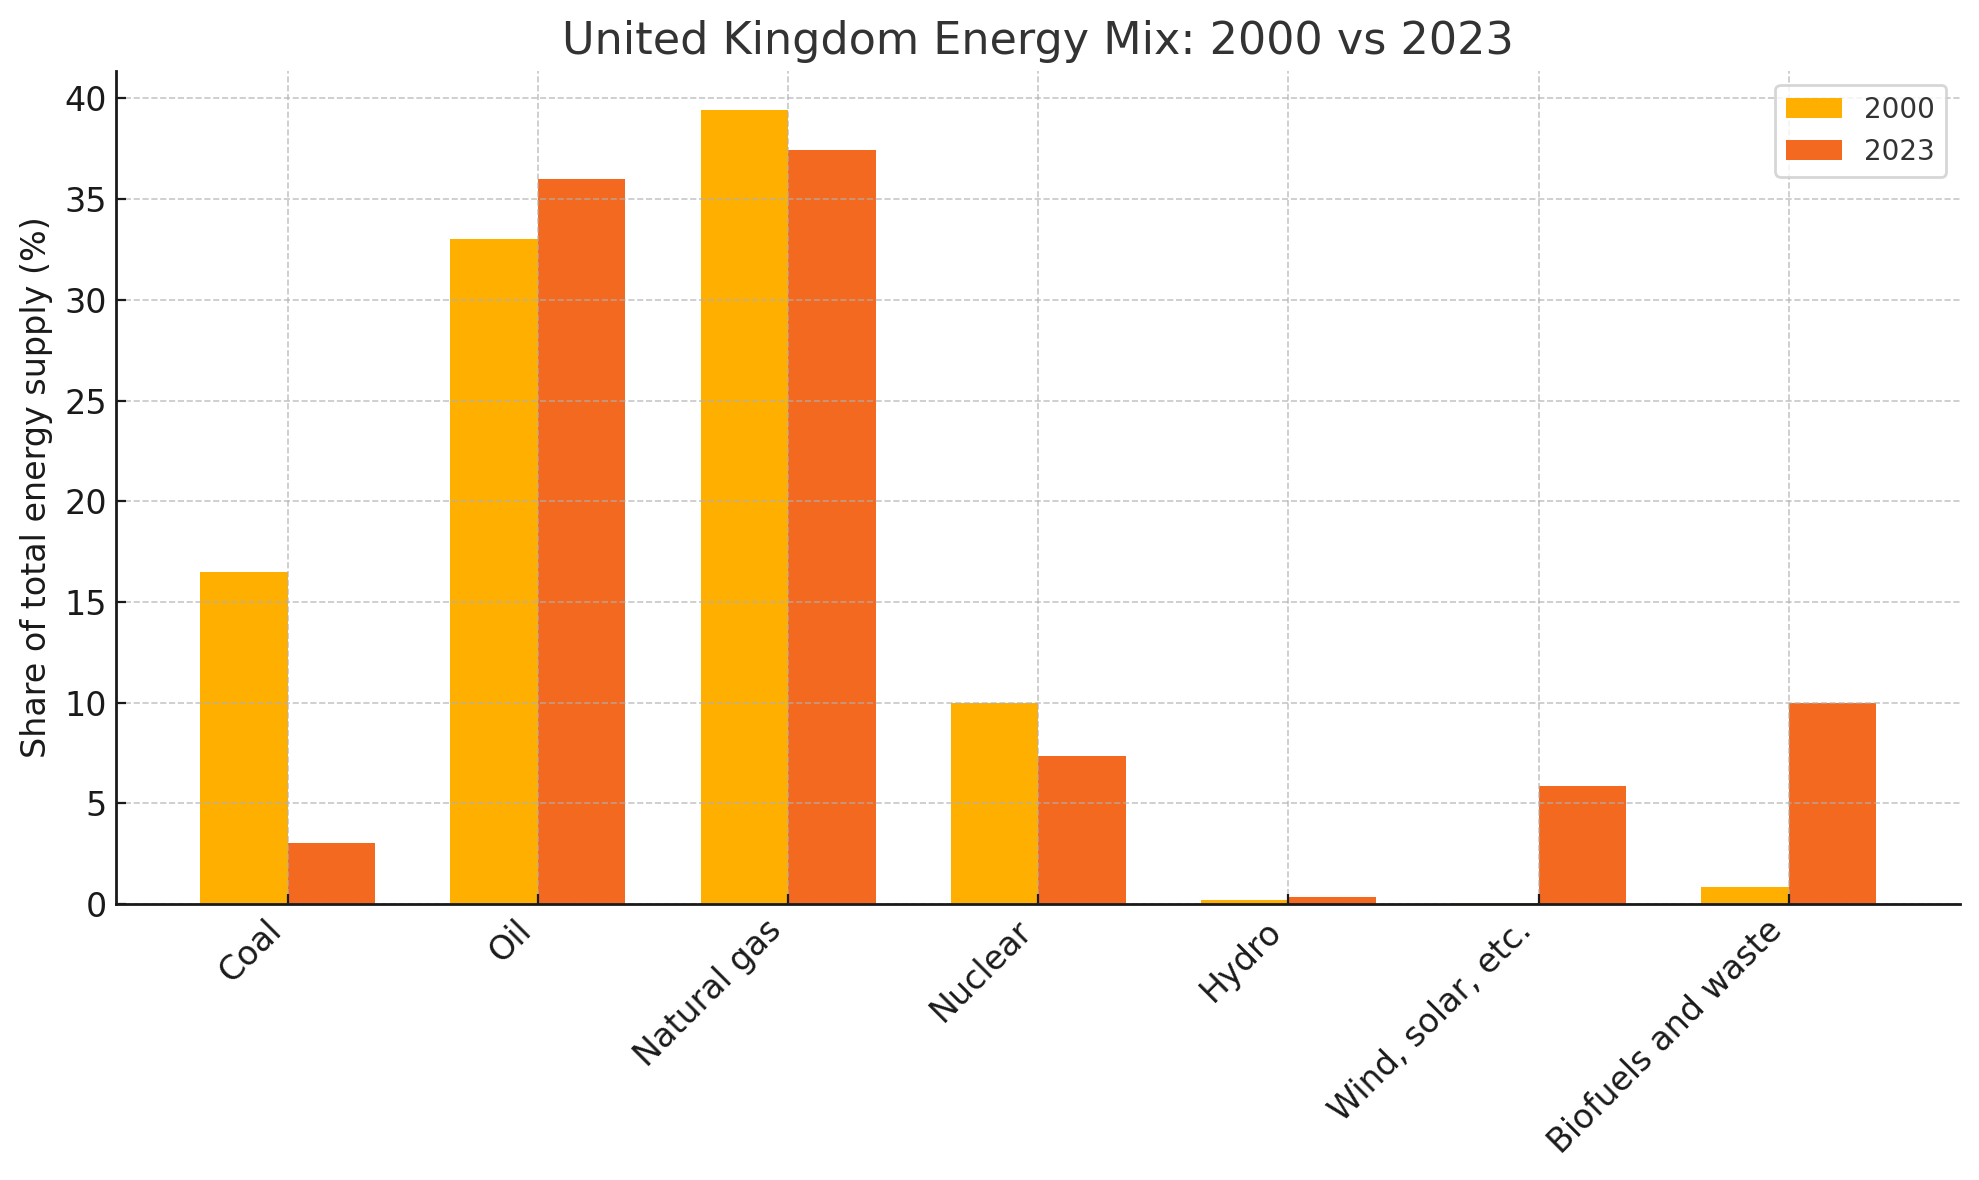
Data source: International Energy Agency
In 2000 coal still supplied 16 % of Britain’s primary energy; by 2023 it was effectively out of the mix, a feat unmatched by any other G7 economy. Renewables plus bio-energy rose from one per cent to sixteen. Yet, oil and, above all, natural gas still shoulder three-quarters of demand. Nuclear shrank as old reactors aged.
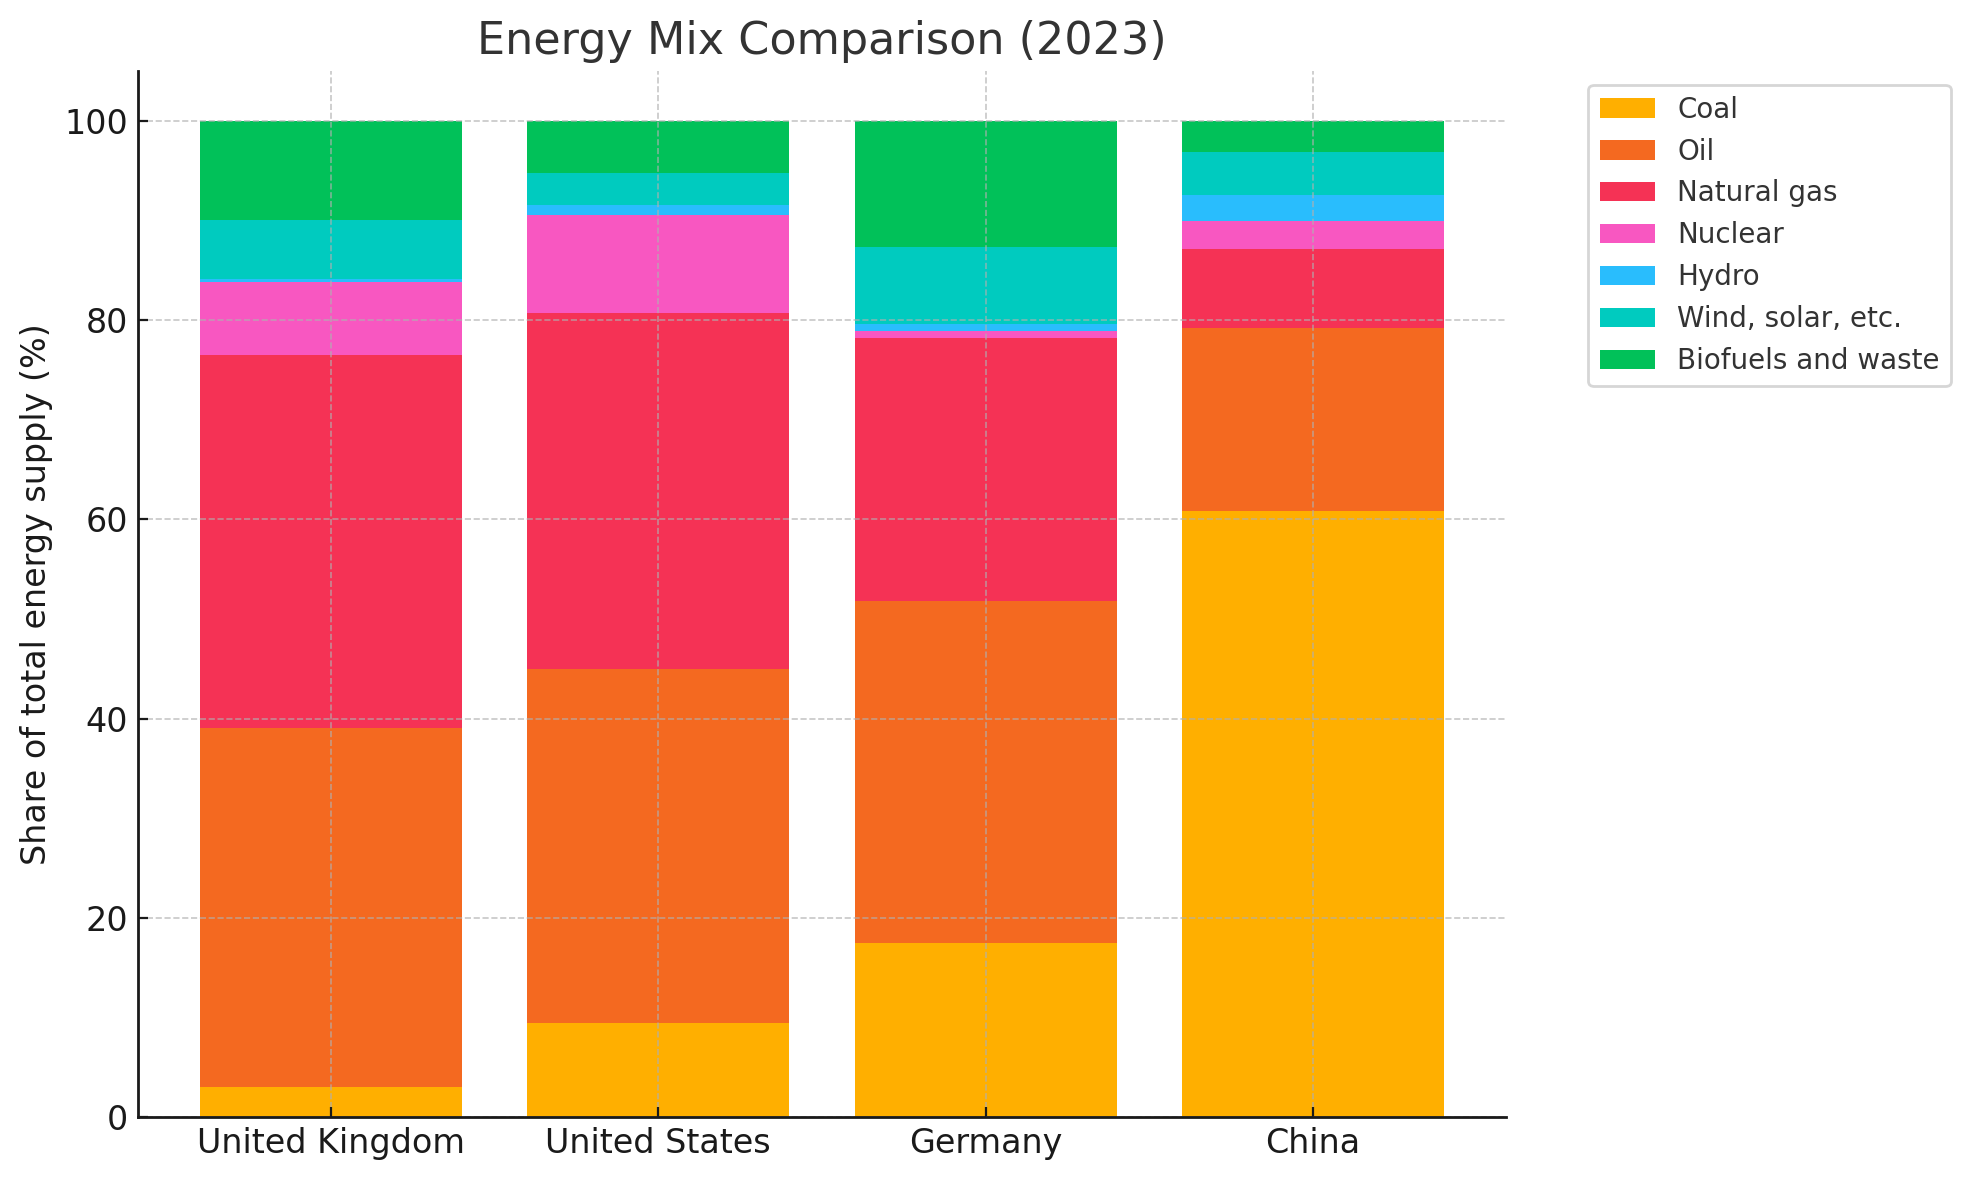
Data source: International Energy Agency
A 2023 snapshot shows Britain ahead of its peers on coal exit but not yet on total fossil dependence:
| 2023 fossil share | Coal’s slice | Wind-solar share |
|---|---|---|
| United Kingdom 76 % | 3 % | 6 % |
| United States 79 % | 11 % | 4 % |
| Germany 84 % | 18 % | 7 % |
| China 90 % | 61 % | 3 % |
Britain’s distinctiveness is the gas pivot: four decades of North Sea output left the U.K. with the world’s highest natural-gas share among major economies, cushioning the coal exit but cementing hydrocarbon reliance.
Twenty-three years in one line plot
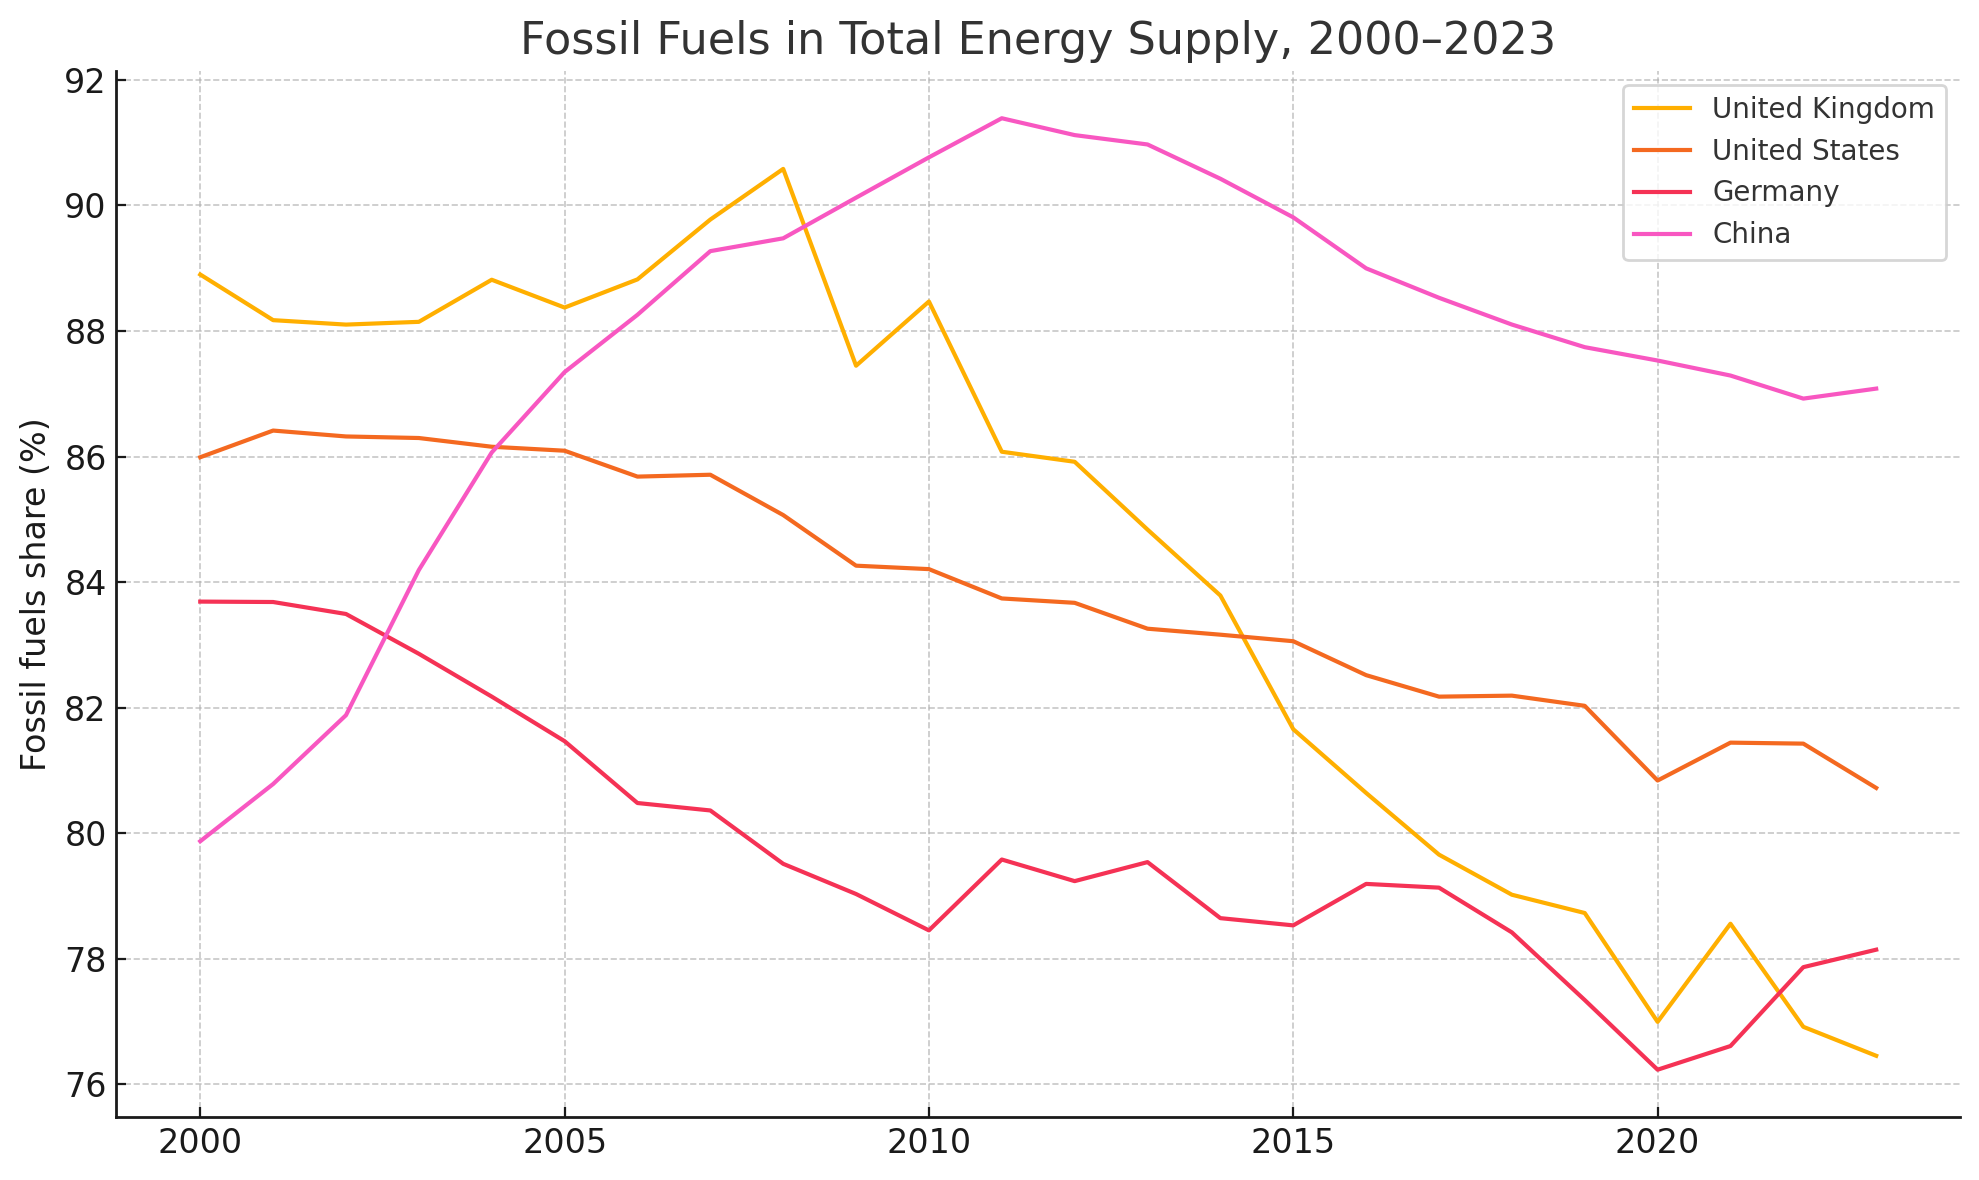
Data source: International Energy Agency
United Kingdom slid nine percentage points, most of it after 2013 as the carbon-price floor punished coal.
Germany fell nearly twelve points—largely by replacing coal with wind, solar and, lately, LNG after the 2022 gas shock.
United States edged down four points, its coal-to-gas “shale swap” offset by still-rising oil demand.
China first climbed, peaking at 91 % in 2011, then eased back only two points despite record renewables investment—because total energy demand kept surging.
Taken together, the benchmarks point to a four-part agenda for Britain’s next phase of decarbonisation. Natural gas has become the new coal: unless home-heating is electrified—via heat pumps, district networks or green hydrogen—and road transport shifts decisively to electric vehicles, the share of gas in the energy mix will remain stubbornly high.
Bio-energy’s quiet ascent to roughly a tenth of supply provides welcome carbon headroom, yet it also raises thorny questions about land use, biomass sourcing and long-term sustainability that policymakers can no longer sidestep.
Nuclear capacity is approaching a cliff edge: absent timely replacements for Britain’s ageing reactors, the nuclear slice could halve by 2030, forcing gas to fill the gap unless renewables expand even faster.
Finally, the international picture offers both cautionary tales and templates—Germany shows how rapid wind-and-solar build-outs can bite into fossil demand when policy is consistent; the United States illustrates the scale unlocked by generous incentives; and China’s experience underscores that renewables alone cannot outrun surging overall consumption. These lessons, viewed through the lens of Britain’s new £10 billion Sumitomo deal, reinforce a simple truth: grid expansion, storage and interconnection must accelerate if the U.K. is to turn its gas plateau into the next steep descent.
The Sumitomo investment is therefore more than a ribbon-cutting headline. It is an early down-payment on the grid expansion, storage and interconnection Britain will need to make the final decarbonisation push—turning the gas plateau in the first chart into the next steep decline.