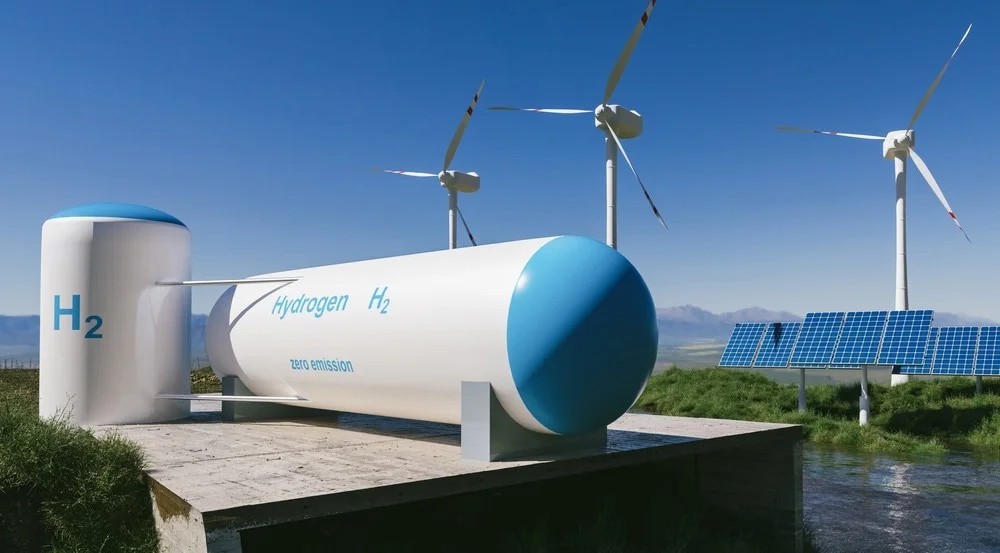
Hydrogen has emerged as a promising resource in renewable energy, capable of decarbonising sectors from steelmaking to long-haul transport. Its key attraction is that, when used in fuel cells or combusted, the only direct emission is water vapour. However, not all hydrogen is created equal. Production methods—and the energy that powers them—determine both the fuel’s true carbon footprint and its commercial competitiveness.
To reflect those differences, the industry assigns each production route a colour. This “hydrogen colour palette” is more than technical jargon: it guides policy incentives, shapes corporate procurement decisions and signals long-term infrastructure needs
Hydrogen production pathways and their key attributes
| Colour | Primary feedstock / process | Typical CO₂ intensity* (kg CO₂ ∕ kg H₂) | Current cost range (USD ∕ kg, 2025) | Commercial maturity | Notes on by-products or infrastructure |
|---|---|---|---|---|---|
| Black / Brown | Coal or lignite gasification (water–gas shift) | 18 – 20 | 1.2 – 2.2 | Established in China, South Africa | Generates large volumes of CO₂ and solid ash; requires gas-clean-up before use |
| Grey | Steam-methane reforming (SMR) of natural gas | 9 – 12 | 1.0 – 2.0 | Global workhorse (≈ 70 % of supply) | Lowest capex but no CO₂ capture; depends on gas price and methane-leak control |
| Blue | SMR or autothermal reforming + carbon capture and storage (CCS) | 4 – 6 (assuming ≥ 90 % capture) | 1.5 – 3.0 | Early commercial; projects in Alberta, Texas, UK | Effectiveness hinges on sustained high capture rates and long-term CO₂ storage liability |
| Turquoise | Methane pyrolysis (thermal cracking) | < 1 if heated with zero-carbon power | 2.0 – 4.0 (pilot-scale estimates) | Pilot plants in EU / US | Produces solid carbon (graphite or carbon black) that can be sold, eliminating CO₂ handling |
| Pink / Red / Purple | Low-temperature electrolysis powered by nuclear electricity (often with steam extraction) | < 1 | 2.0 – 4.0 | Demonstration: France, Canada, US | Provides 24 ⁄ 7 baseload H₂; economics tied to nuclear plant operating costs |
| Yellow | Electrolysis powered exclusively by onsite solar PV | < 1 | 3.5 – 6.0 (depends on solar yield and utilisation) | Commercial in sunny regions | Output fluctuates with irradiance; usually paired with battery or H₂ storage for steady supply |
| Green | Electrolysis using a mix of renewables (wind, solar, hydro) | < 1 | 3.0 – 6.0 today; sub-3 projected by 2030 in high-resource areas | Rapidly scaling; > 600 announced projects | Zero direct emissions; competitiveness improves with cheap renewable power and 45V / RFNBO incentives |
| White (natural) | Geologic hydrogen vented from subsurface reservoirs | Data limited; likely low | To be determined | Exploration phase (US, Mali, France) | Could bypass energy-intensive production, but volumes and extraction economics remain uncertain |
WHY THE PALETTE MATTERS
Global hydrogen output already sits near 70 million tonnes a year, most of it grey, and that single industry emits roughly 830 million tonnes of CO₂—more than Germany produces annually. Moving even a slice of this volume up the colour spectrum therefore has outsized climate impact. Engineering firm Worley counts more than 600 low-carbon hydrogen projects on its books, evidence that scale and cost hurdles are beginning to fall.
Cost gaps are narrowing thanks to technology breakthroughs. Norwegian researchers recently shaved membrane thickness by one-third and cut platinum content by 62 percent in fuel-cell stacks, lowering stack costs by about 20 percent. Advances like this make green or pink hydrogen more competitive downstream, where fuel cells turn the gas back into electricity.
COLOURS IN MOTION
• Rail: Siemens is building three two-car Mireo Plus H regional trains for Bavaria. Each set will travel up to 1 200 kilometres on green hydrogen and enter service in 2026.
• Infrastructure: Deutsche Bahn and UK electrolyser maker ITM Power plan to seed green-hydrogen depots across Germany so rail fleets fill up with the cleanest fuel.
• Road: China’s FAW Hongqi has passed stringent tests on its latest fuel-cell sedan, cutting hydrogen consumption about 15 percent below rival models.
Colour labels offer a convenient shorthand for hydrogen’s carbon intensity, but policymakers and investors now prioritise precise lifecycle metrics—specifically, grams of CO₂ per kilogram of hydrogen. Production pathways that achieve the lowest emissions at commercial scale—whether blue as a transition option, turquoise with marketable solid-carbon by-products, or green via renewable electrolysis—are expected to secure the largest share of future investment and deployment.
