Contents
Wind resource assessment is one of the first steps when considering a wind turbine for any particular location. Courtesy of the aviation industry, wind data has been already measured for numerous sites around the world. Meteorological departments in several countries have released average wind speed maps. However atmospheric wind as much as a climatic event is also a localized phenomenon that is hugely influenced by surrounding topography and obstacles. The best practice therefore is to measure the wind speed on the site of interest rather than extrapolating wind data from surrounding sites. The quality of wind resource varies and can be assessed by understanding the following parameters:
Average Wind Speeds
Average wind speed is one of the foremost factors that determine the quality of wind resource. The feasibility of a site for wind power can be instantaneously ruled out based on this factor alone. As a thumb rule, an average velocity of 5 m/s at 10m elevation is generally understood as a healthy number for feasibility of wind turbines. However there have been installations in areas where average velocities have been as low as 3.5 m/s. This is mainly because of the lack of other indigenous energy options. Secondly, even if the average wind speed is low but variability in wind speed it high, the overall output of the turbine can be higher than a turbine facing near constant wind speed. This anomalous behaviour has been explained in detailed in this article. However variability in wind speed provides inconsistent and unreliable power. Unless storage options are added, it does not make economic sense to invest in low average wind speed sites.

Annual Mean Speed for UK at 25 m above ground level. Courtesy ETSU.
Planet earth can be divided into zones that have high and low average wind conditions. Regions that are dominated by high pressure generally have poor wind resource. These regions can be visually identified on the map by their arid outlook, such as deserts. In contrast regions that are dominated by low barometric pressure for most part of the year generally have higher quality wind resource. These can also be identified visually on the map as naturally green areas (high precipitation zones). The ITCZ (Inter tropical Convergence Zone) and Sub Polar Low Pressure Belt are regions where wind turbines location is mostly feasible. In contrast the Sub Tropical High Pressure belt is not the region where many wind farms will be found.
Atmospheric Boundary Layer
The boundary layer phenomenon is well known to mechanical and aeronautical engineers. It results because of fluid viscosity. The velocity of any flowing fluid if comes in touch with a surface is affected. The viscosity forces the velocity of the layer of fluid in touch with the surface to reduce to zero. The layer above the contact layer slips on but again viscous forces result a reduced speed. The effect of the surface gets reduced on the fluid reduces as fluid particle moves away from the surface till it achieves a free stream velocity.
Similar is the case with our atmosphere and surface of the earth. Winds closer to the surface are slower as we move away from the ground/sea level. Wind velocity keeps on rising asymptotically as one moves upwards through 5 m, 10 m, 20 m and 30 m elevation till it achieves a constant value. The thickness of atmospheric boundary layer depends upon both the speed of wind and surface obstacles. It can reach up to 100m. For wind power, this means higher wind speeds can be anticipated if the turbine mast is placed high. It should be noted that wind speed and power have a cubic relationship. Doubling the wind speed means 8 times rise in power.
Wind Direction
The assessment of prevalent wind direction is important for any site where wind farm is being planned. Normally a “Met mast” is installed for a period of an year. Once the prevalent wind direction is established it should be made sure that there are no obstacles (buildings, trees and pylons) in the line of site. If there are multiple turbines to be located than it should be made sure that turbines are not installed such that they fall in each other’s wind shadow particularly in the prevalent wind direction.
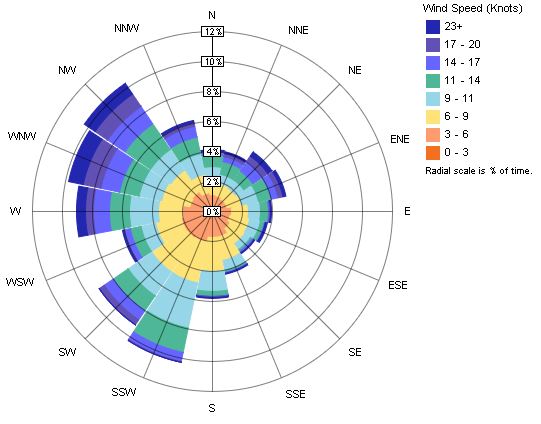
Wind data depicted as Wind Rose. Courtesy Autodesk
In addition to the prevalent wind direction, the frequency of change in wind direction also has to be considered. If wind is variable and changes direction very every few seconds than again the site is classed as low quality wind. Note that if the site is present in a valley or around a hill, than localized topographical factors can create a funnelling effect. This can enhance the both the wind speed and maintain consistent wind direction which in turn increases the output of the turbine. Recorded wind data can be displayed in the form of wind rose (as shown in the picture). A wind rose reveals the prevalent wind direction in a snapshot. For example, in the example here SW to NW is the direction of prevalent wind.
Turbulence Intensity
Simply put, turbulence is the random movement of air particles in the oncoming wind. The higher the randomness and fluctuation in speed, the more is turbulence. High turbulence is a serious cause for concern. Turbulence not only causes a drop in the output but also induces vibration in the blades of the turbines that can cause structural damage in the long run. The power curves for turbine, for various levels of turbulence are shown in the chart (right) by the American Meteorological Society. The drop in turbine output with rising turbulence can be noticed.
Turbulence is measured in a variety of ways, with Turbulence Kinetic energy being one of the metrics. However the most common way is to express it in the form of Turbulence intensity.
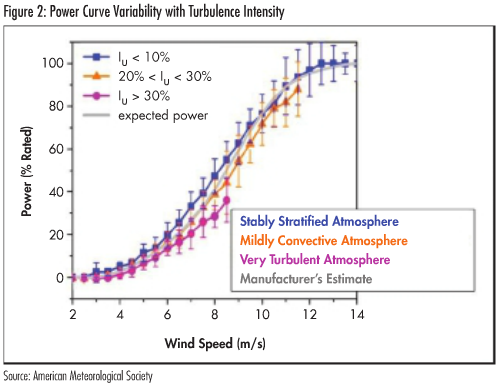
Turbulence Intensity Vs Power Curve
Courtesy: American Meteorological Society
Mathematically it can be expressed as
I = u’/U
Where u’ is the root mean square of the velocity fluctuations. U is the mean wind speed. For example, if the mean wind speed is 1 m/s while the velocity fluctuates between 0.9 m/s and 1.1 m/s than Turbulence Intensity is 0.1 or 10%. It should be noted that generally wind blowing over a body of calm waters has a lower Turbulence Intensity. On the other hand Turbulence Intensity of wind blowing past a wooded area is much higher. Thus offshore winds turbines generally have a higher capacity factor compared to their onshore counterparts. Generally Turbulence Intensity of 20 % means extremely high degree turbulence.
As mentioned earlier turbulence substantially increases in the wake of the turbine and provision must be made that other turbines in the farm are not located in the line of sight of prevailing wind. It has been noted that due to lower background turbulence, the structural damage on the wind turbines on the edge of the wind farm is much lower compared to turbines sitting in the middle of the farm.
IEC 61400 Standard
The International Electrotechnical Commission is a body that prepares standards for electrical, electronics instruments and other related technologies. It has published IEC 61400 that is related to wind turbine. The reason for publishing this standard was simple, to identify “horses for courses”. Different wind turbines have to be designed for different wind conditions. The standard identifies seven different wind speeds. They have been listed below.
| Wind Class/Turbulence | Annual average wind speed at hub-height(m/s) | Extreme 50-year gust in meters/second
(miles/hour) |
|---|---|---|
| Ia High wind – Higher Turbulence 18% | 10.0 | 70 (156) |
| Ib High wind – Lower Turbulence 16% | 10.0 | 70 (156) |
| IIa Medium wind – Higher Turbulence 18% | 8.5 | 59.5 (133) |
| IIb Medium wind – Lower Turbulence 16% | 8.5 | 59.5 (133) |
| IIIa Low wind – Higher Turbulence 18% | 7.5 | 52.5 (117) |
| IIIb Low wind – Lower Turbulence 16% | 7.5 | 52.5 (117) |
| IV | 6.0 | 42.0 (94) |
When a wind turbine is selected, it normally comes with the IEC specification. Therefore it is important that the site wind data should be measured and classified so to select the right type of turbine.
In addition to average wind speed and direction there are additional factors that are also required from an environmental and aviation point of view for wind farm consideration. The estimate of migratory birds that pass through the site is important to measure to gauge ecological impact of wind farm. For this purpose avian radar are normally installed in addition to the met mast. Similarly, if the site falls in an area that is close to approach flight path ( during landing/take off) than the turbines can potentially cause interference with the radar systems.
Also worth reading:
Wind Farm Planning Considerations
All you need to know about Solar Radiation
Please feel free to share this article using the buttons below.