Carbon foot printing has become synonymous with Global warming. Measuring and understanding carbon emissions is relatively easy. The theory is simple the more carbon di oxide goes in the atmosphere, the more acceleration in the rise of global temperature. Over the last three decades, this trend has prevailed and still continues. For gases released as a result of human activity other than carbon di oxide, a value called “ global warming potential” (GWP) is worked out. The global warming potential for CO2 is set at “1”or unit value. Every other gas is measured against carbon di oxide and it global warming potential is calculated. For instance methane has a GWP of 24, this means that 1 kg of methane released in the atmosphere is equivalent to 24 kg of CO2 released, with respect to impact on atmospheric warming. Similarly SF6 or Sulphur Hexafluoride is has a GWP of 22,800. This tells us that the gas is extremely potent in terms of Global warming. This factor of GWP was previously ignored, but is now measured and checked. The noose is tightening on greenhouse gases and is yielding some positive results. Similar to Montreal protocol, after which CFC’s were gradually phased out Kyoto protocol is having an impact.

Ecological Footprint
In light of GWP, CO2 equivalent factors have been devised. The links for emission conversion factors used by the UK government for greenhouse gas reporting can be accessed from the following link.
Notice that the some factors have changed over time. This is mainly because of better understanding of the process and secondly change in circumstances/conditions. For example, if oil comes from the North Sea, than there is very little CO2 released in its transportation to UK. If however it is imported from US or Saudi Arabia, then the CO2 released on its transport ramps up. This additional CO2 is taken into account and added to the emissions that result as consequence of burning oil.
Similarly every country should estimate its own carbon factors for every fuel that should include:
- The CO2 released as a result of burning the fuel
- The CO2 equivalent of other gases released
- The CO2 released as a result of handling/transportation of fuel
The Carbon foot-print measure has helped bring the disastrous impact of human activity to the fore. It has to an extent identify some major culprits like fluorinated gases and has helped in shifting our priorities. Nonetheless it is not a precise gauge to measure the overall impact of human activity on ecological systems.
A more precise system of measurement is the ecological footprint.
What is Ecological footprint
The fundamental idea is planet earth has fixed amount of resources that can be used and nature replenishes a certain amount of these resources every year. Using resources equivalent to what the planet replenishes would make human activity sustainable. If human activity can exceed the natural replenishment levels but it has to tap into natures capital. This is exactly what has been happening for decades.
The ecological factors takes into account the land use, the water use and other resource use by human activity. It is measured in hectares per capita. For urban environments the Ecological footprint is much higher. It is also high for developed countries compared to developing countries. Not just the energy usage but water usage is also very high in cosmopolitan cities. For example in most mega cities in the western world, 80-100 litres of water is used per capita per day. An average citizen in Karachi, Pakistan on the other hand consumes less than 20 litres per day. Water usage is obviously ignored in carbon foot printing.
It has been pointed out Post Carbon Institute, that the average world citizen has an eco-footprint of 2.7 global average hectares. This is 30% higher than the bio-productive land which stands at 2.1 hectare. This means that humanity is living unsustainably and tapping into natural capital.
It was first academically publicized by William Rees in 1992. Over time it has been refined by many academics world over. Factors like nuclear waste management have also been incorporated. Eco-footprint can be used to explore the sustainability of individual lifestyles, goods and services, organizations/ industry as well as neighborhoods, cities, regions and nations.
Ecological Footprint Country List
It can be noticed that CO2 foot printing despite its popularity and universal acceptance is an extremely simplistic tool. Ecological footprint on the other hand is much more holistic. While pursuing policies for alleviating global warming CO2 foot printing can be used but we as a species must not lose our focus on the greater picture that has resulted in un-sustainability and loss of bio diversity in addition to decreasing our planets natural bio-capacity. It is no doubt, the gauge that will keep our relationship steady with our planet is the ecological footprint.
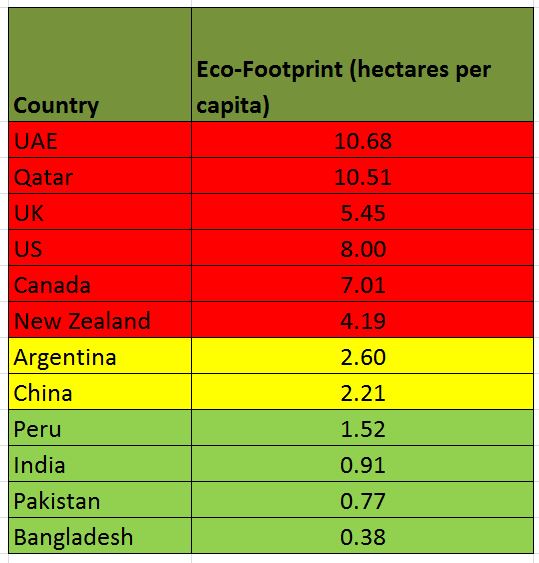
Some Eco-footprints by countries are listed below:
| Country | Eco-Footprint (hectares per capita) |
| UAE | 10.68 |
| Qatar | 10.51 |
| UK | 5.45 |
| US | 8.00 |
| Canada | 7.01 |
| New Zealand | 4.19 |
| Argentina | 2.60 |
| China | 2.21 |
| Peru | 1.52 |
| India | 0.91 |
| Pakistan | 0.77 |
| Bangladesh | 0.38 |
As can be noticed that middle eastern countries have one of the highest eco-footprints while Bangladesh (0.38) along with Puerto Rico (0.14) has one of the lowest. Solutions for reducing carbon and eco-footprint in the middle east have been thoroughly explored in this article.
Also worth reading
How to earn big becoming a carbon consultant
100% coal free what is next for Scotland
Please feel free to share this article using the buttons below.